Stock Status and Conservation Information
(From ISC26 Plenary Report)
Albacore
 Click here to see the ISC25 stock status and conservation information.
Stock Status
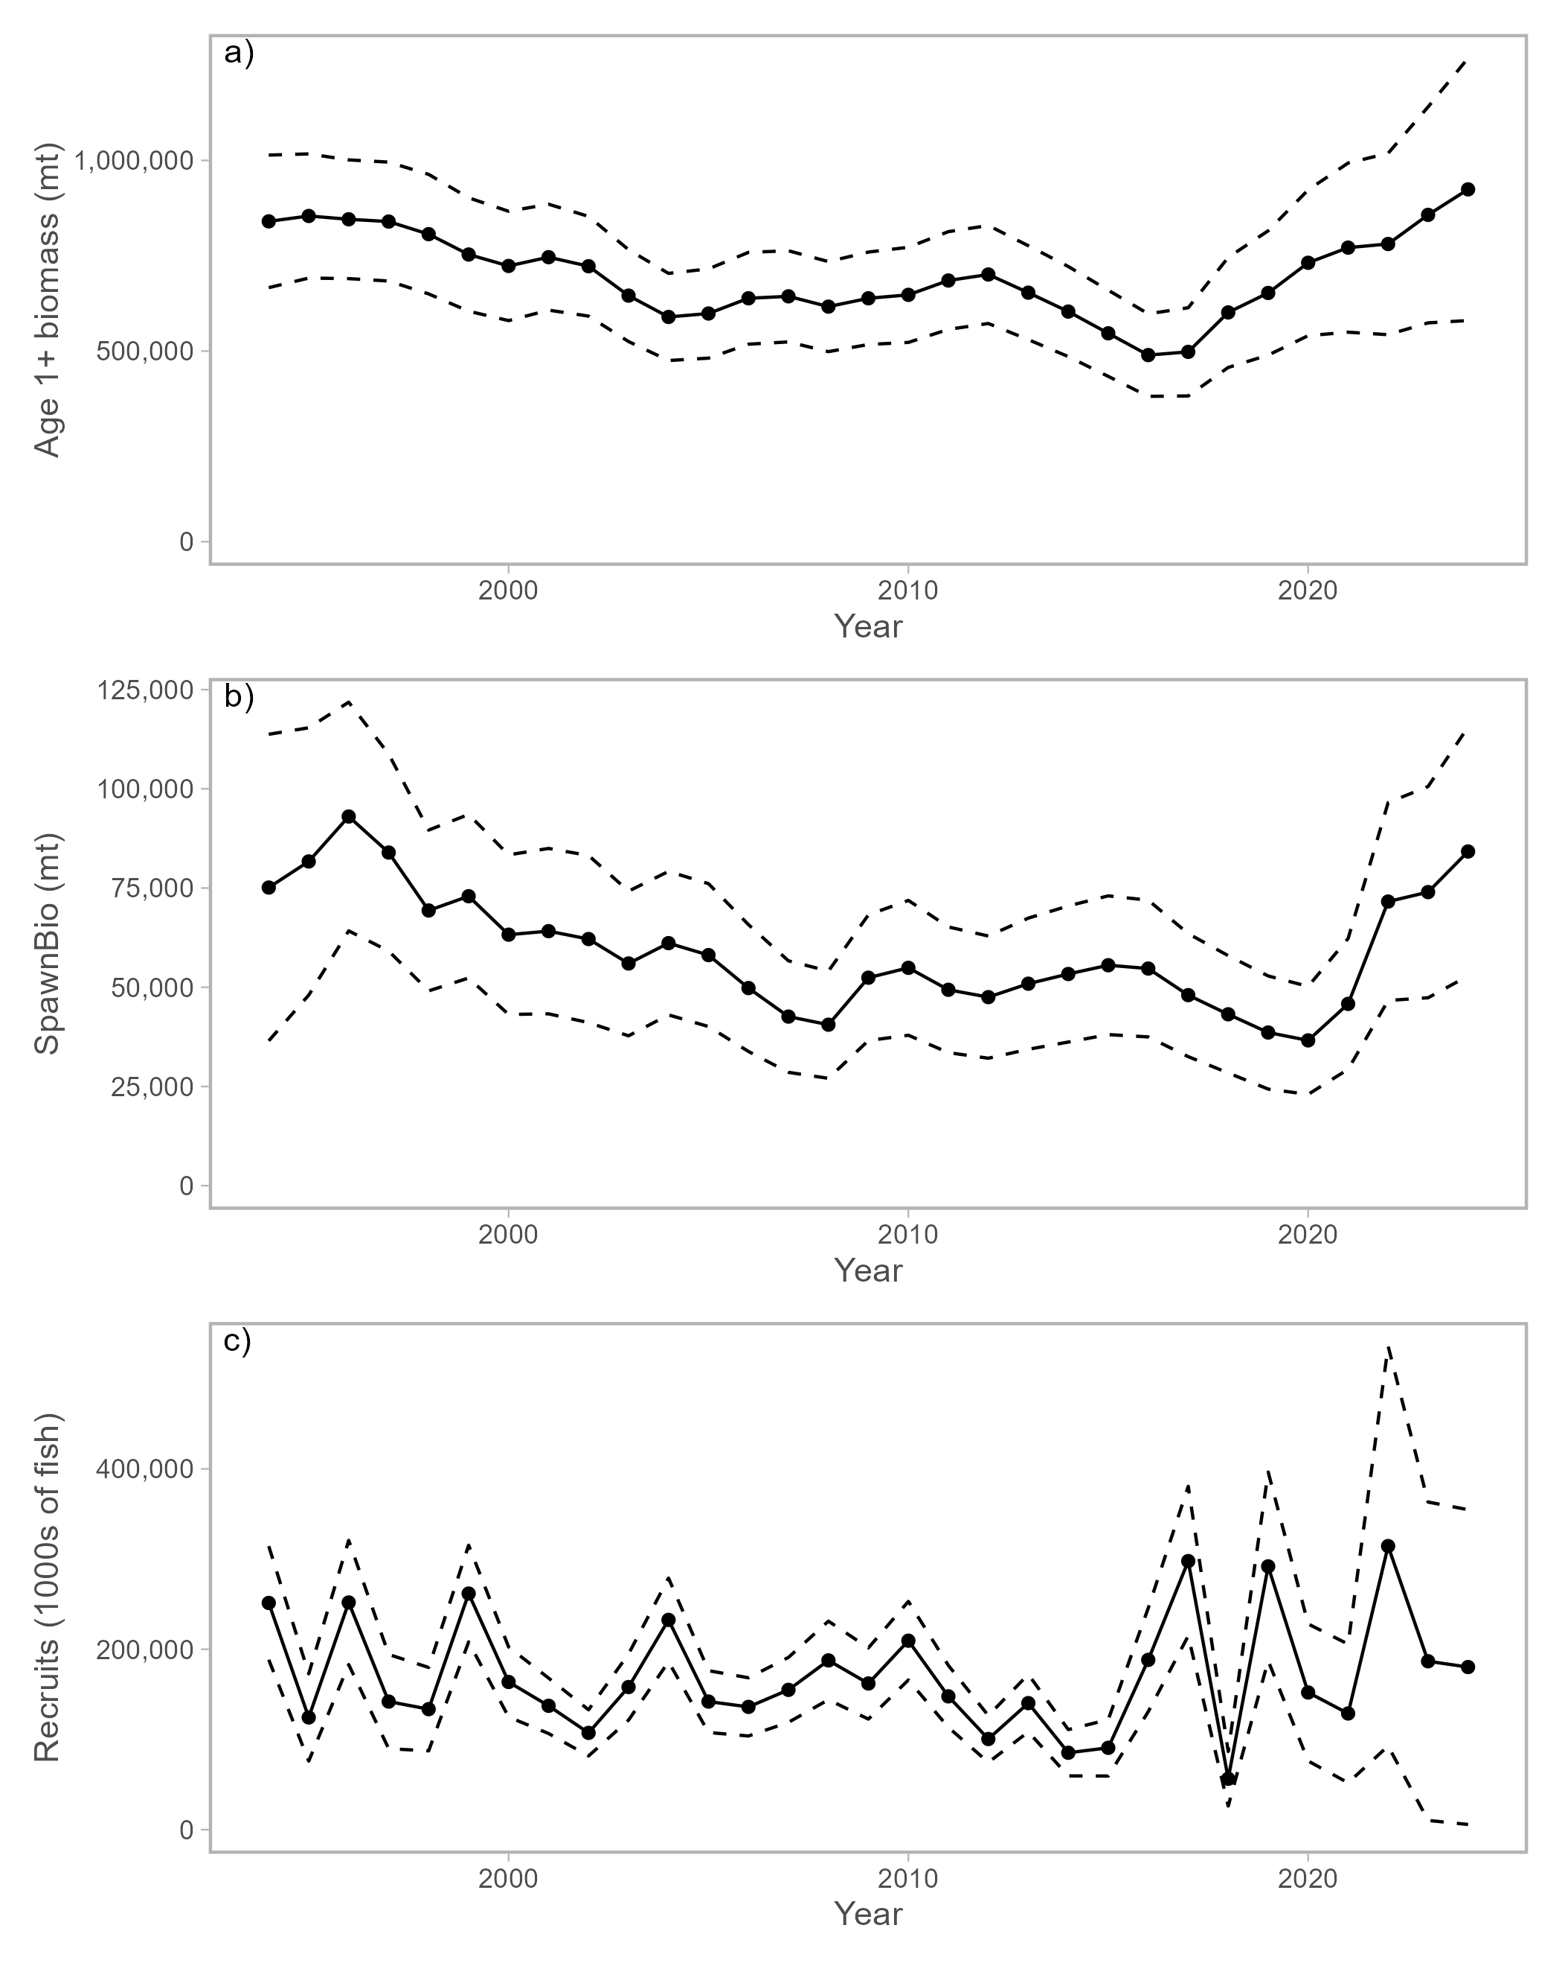
Estimated summary biomass (males and females at age-1+) declined at the beginning of the time series until 2004 (Figure 1). Subsequently, the summary biomass fluctuated without a clear trend until 2018, after which the biomass increased to values higher than those at the beginning of the model time period. It should be noted that the high summary biomass estimates since 2018 also had increasing uncertainty (Figure 1). These high summary biomass estimates can be largely attributed to several strong recruitment estimates in 2017 (∼297 million fish; 95% CI: 215– 381million fish), 2019 (∼292 million fish; 95% CI: 187 to 396 million fish), and 2022 (∼314 million fish; 95% CI: 93-536 million fish) (Figure 1). However, it should be noted that the recruitment estimates in the last 5 years (2020-2024) were highly uncertain and should be treated with caution. Estimated female SSB exhibited a similar trend to the summary biomass, albeit with a lag of several years, and showed an initial decline until 2007 followed by fluctuations without a clear trend through 2020 (Figure 1).
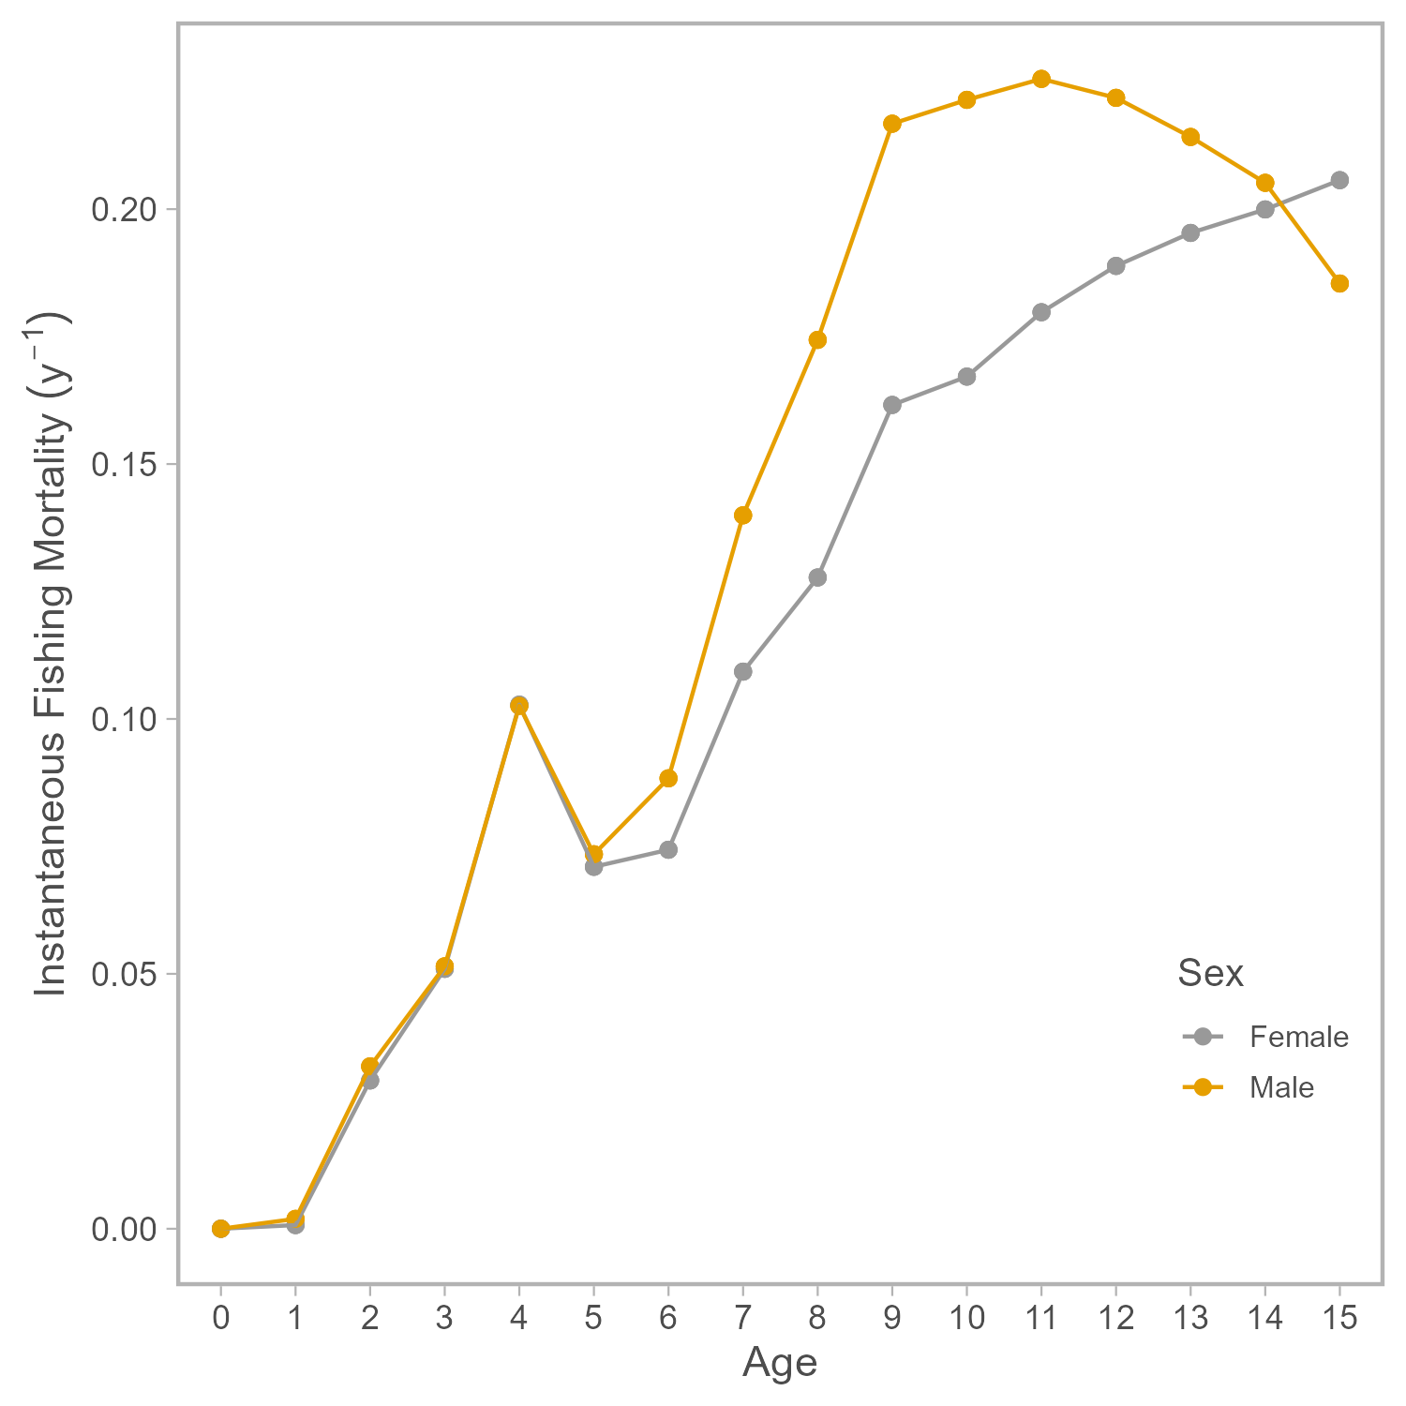
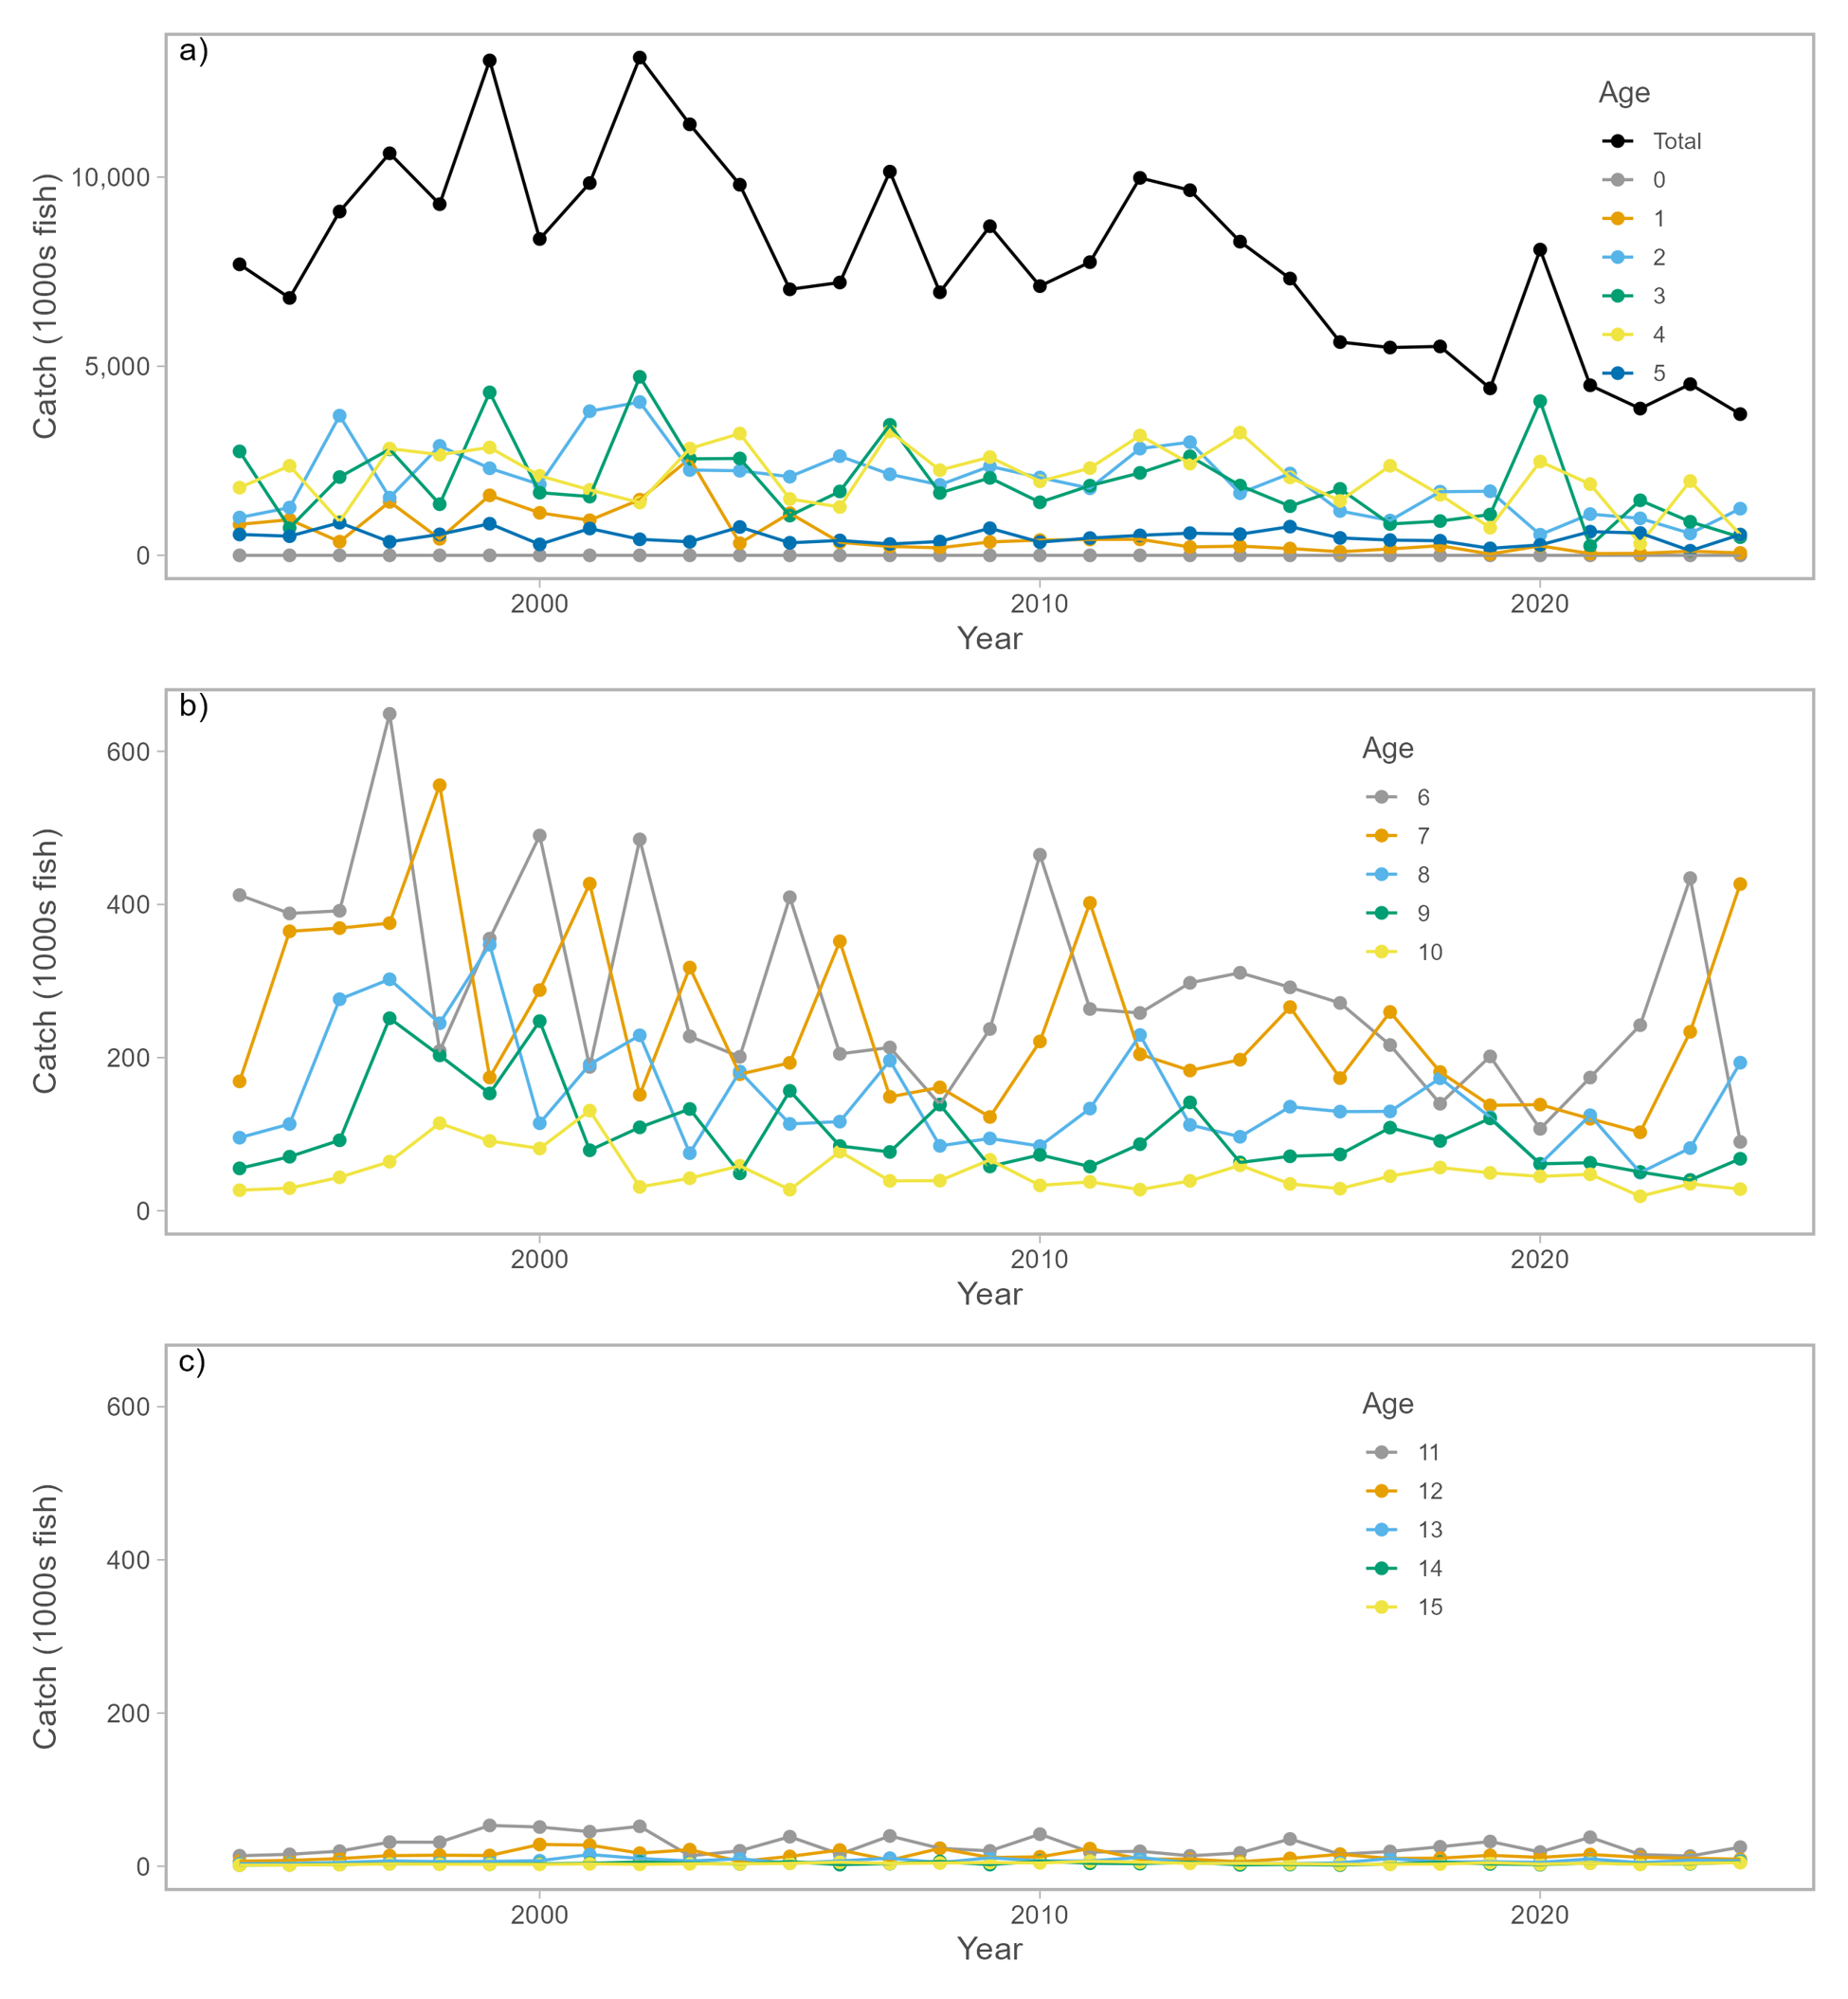
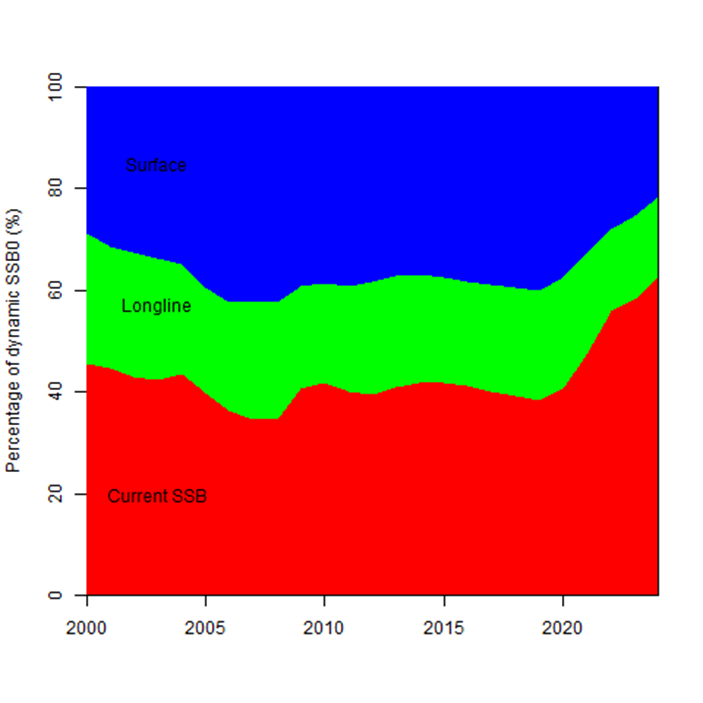
The average fishing intensity during 2021 – 2023 was estimated to be F66%SPR (95% CI: F74%SPR – F57%SPR), which was relatively moderate and resulted in a population with an SPR of approximately 66%. Instantaneous fishing mortality at age (F-at-age) was similar in both sexes through age-5, peaking at age-4 and declining to a low at age-6, after which males experienced higher F-at-age than females up to age 14 (Figure 2). Juvenile albacore aged 2 to 4 years comprised approximately 76% of the annual catch-at-age in numbers between 1994 and 2024 (Figure 3) due to the larger fishery impact of surface fisheries (primarily troll, pole-and-line), which remove juvenile fish, relative to longline fisheries, which primarily remove adult fish (Figure 4).
Stock status is depicted in relation to the target (F45%SPR), threshold (30%SSBcurrent,F=0), and limit (14%SSBcurrent,F=0) reference points (Figure 1; Table 1). The estimated female SSB has never fallen below the threshold and limit reference points since 1994, albeit with large uncertainty in the terminal year (2024) estimates. The historical fishing intensity was estimated to have exceeded the target reference point for most years between 1997-2018. However, the estimated fishing intensity has been declining since 2019 and has been below the target reference point for the last six years. Even when alternative hypotheses about key model uncertainties such as growth were evaluated, the point estimate of female SSB in 2024 (SSB2024) did not fall below the threshold and limit reference points (Figure 5). Estimated average fishing intensity during 2021-2023 (F2021-2023) did not exceed the target reference point under the alternative hypotheses (Figure 5; Table 1). Average fishing intensity from 2021-2023 also did not exceed the average fishing intensity during 2002-2004 (Table 1).
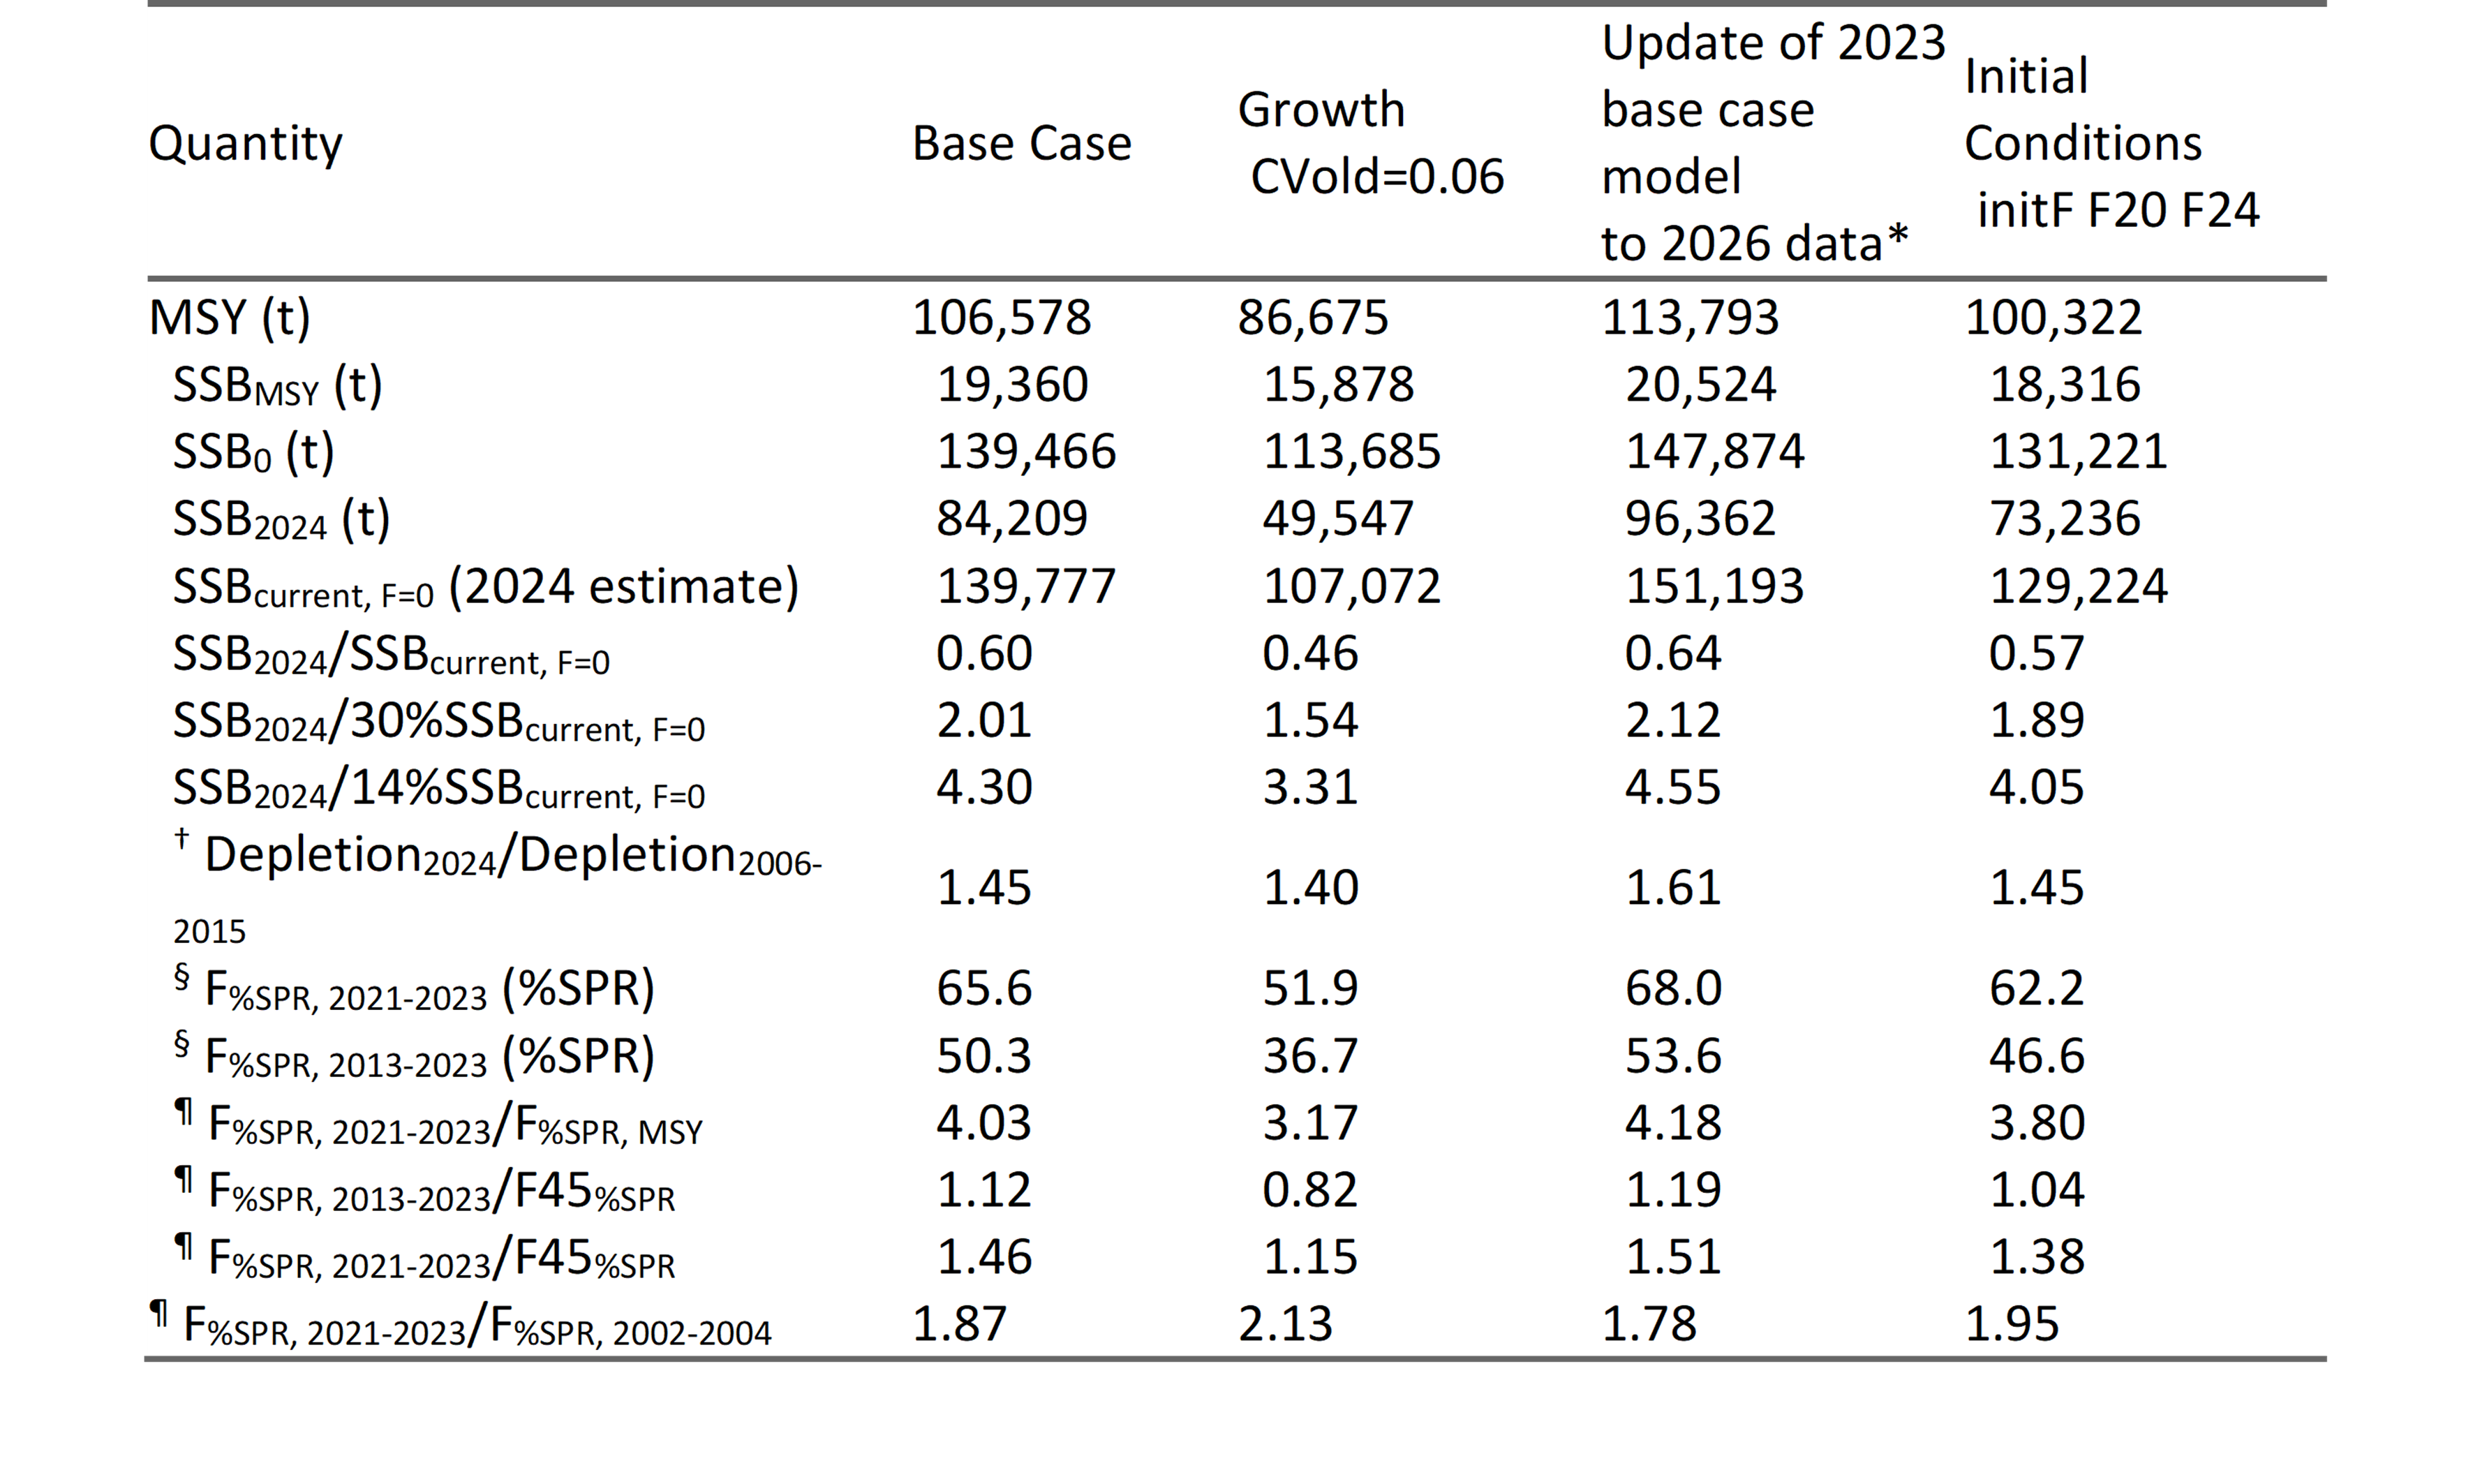
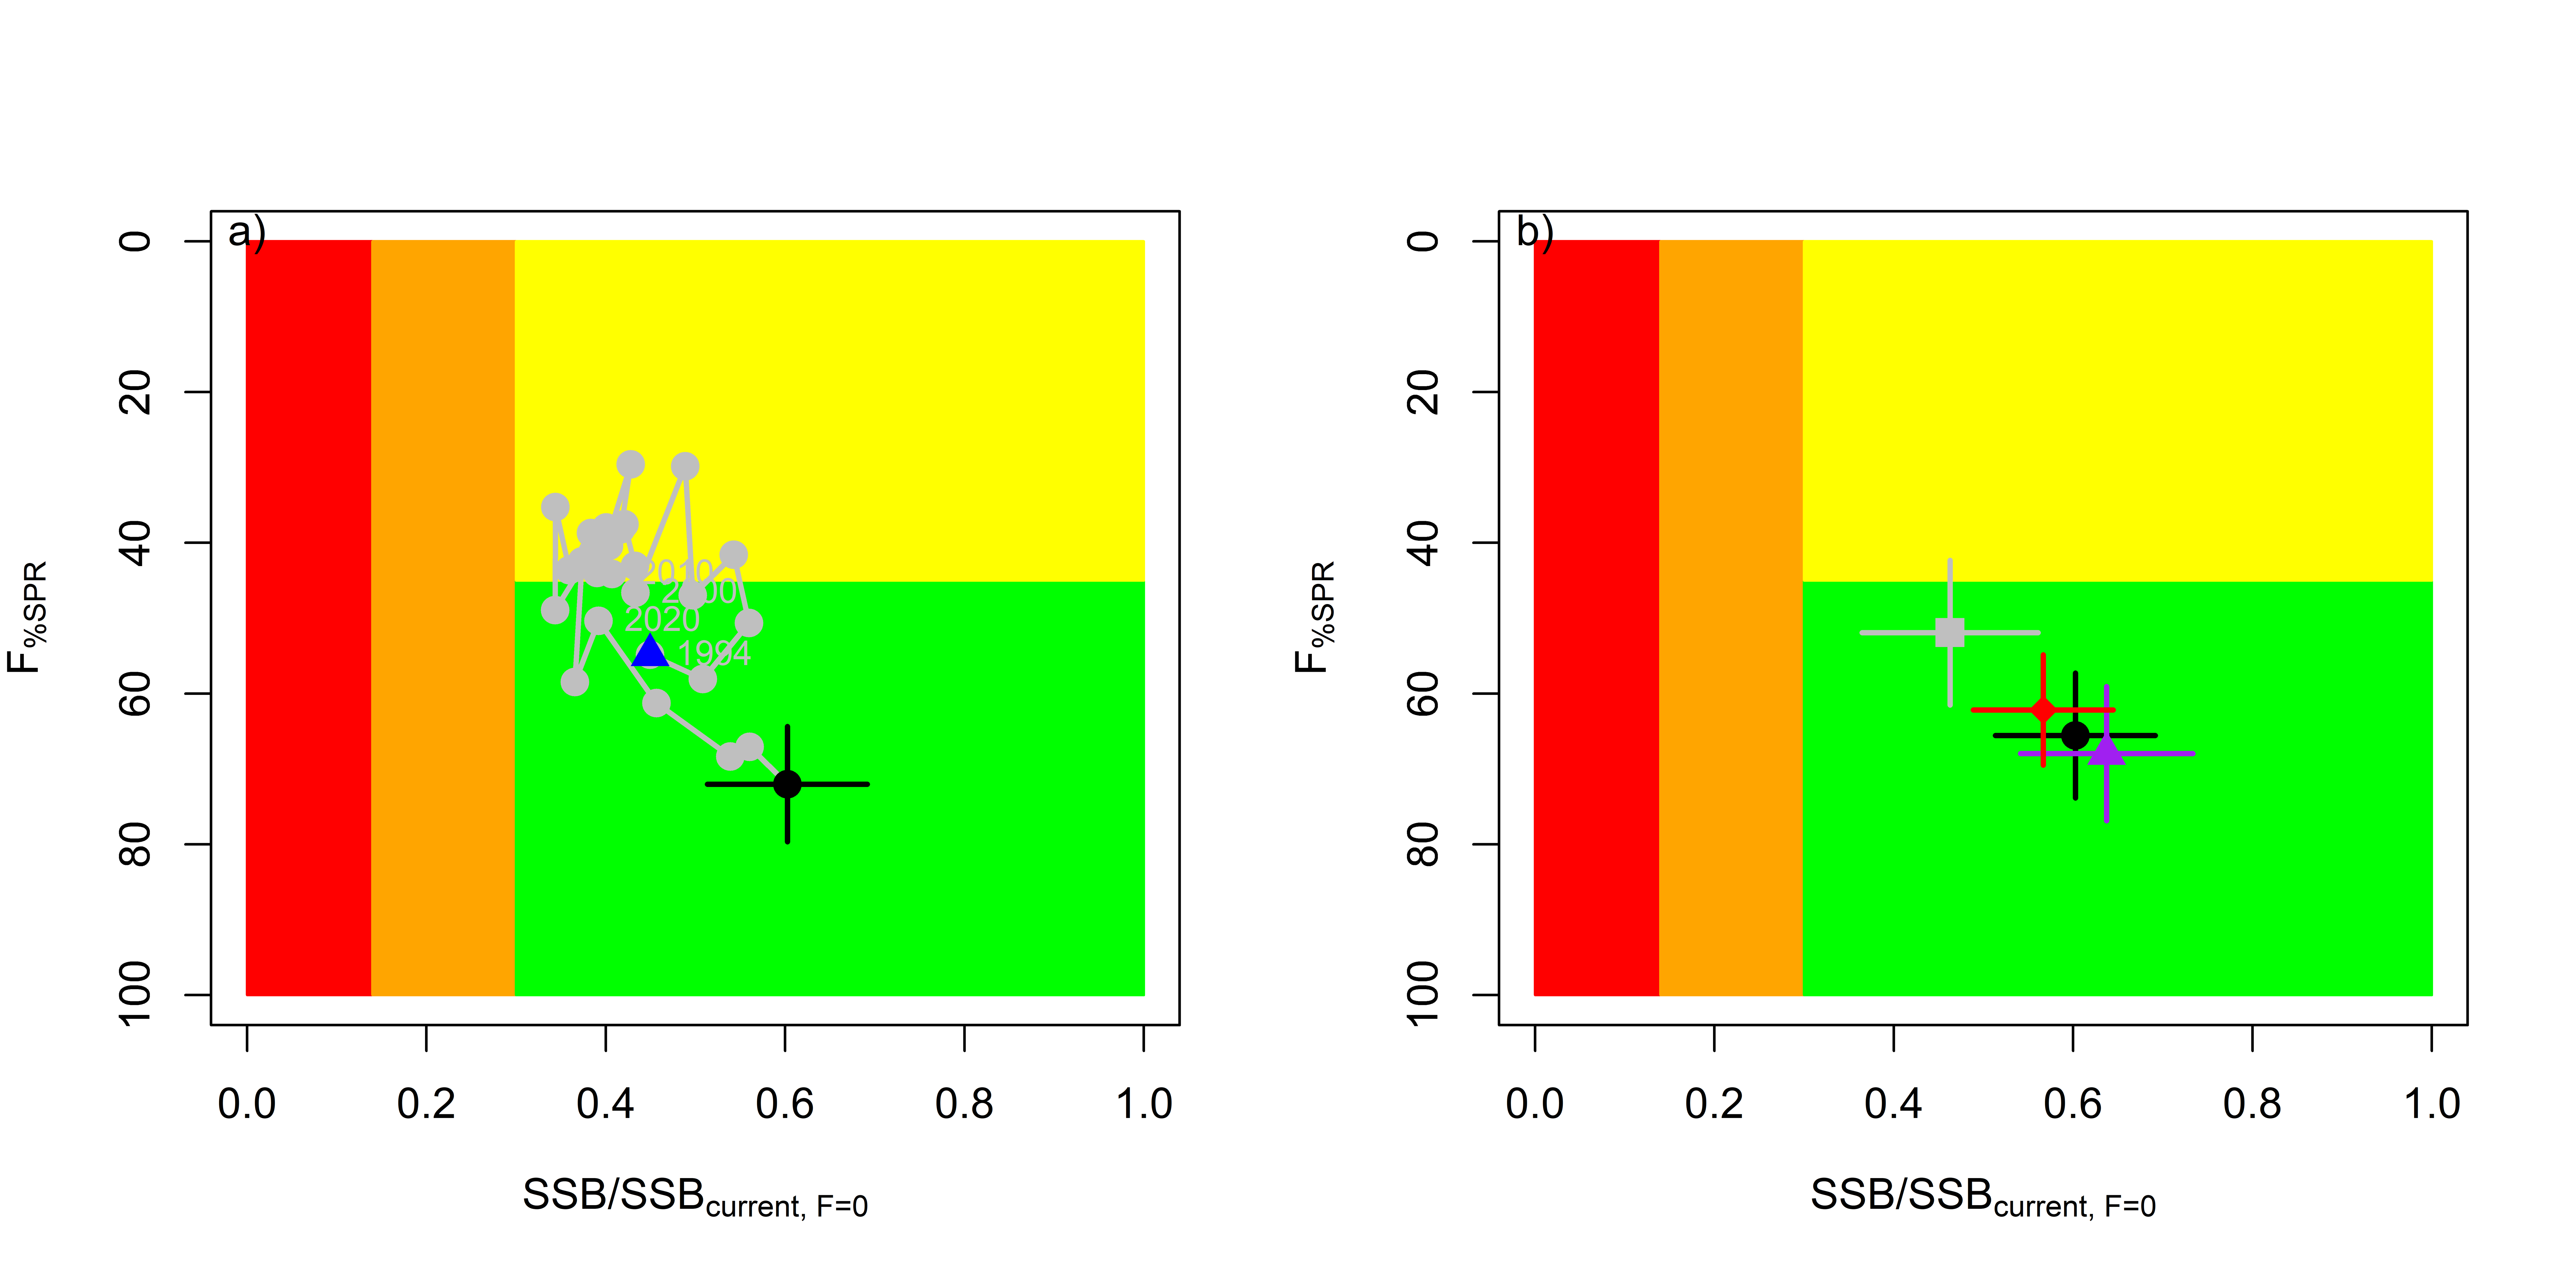
The SSB2024 was estimated to be approximately 60% (95% CI: 38 – 83%) of SSBcurrent,F=0 and 2.01 (95% CI: 1.26 – 2.76) times greater than the estimated threshold reference point (Table 1). The estimated current fishing intensity (F2021-2023) was estimated to be F66%SPR (95% CI: F74%SPR – F57%SPR) and was lower than both the F45%SPR target reference point and the average fishing intensity during 2002 – 2004 (Table 1).
Based on these findings, the following information on the status of the north Pacific albacore stock is provided:
- The stock is virtually certain (>99%) not to be overfished relative to the threshold (30%SSBcurrent,F=0) and limit (14%SSBcurrent,F=0) reference points adopted by the WCPFC and IATTC, and
- The stock is virtually certain (>99%) to be not experiencing overfishing relative to the target reference point (F45%SPR).
Conservation Information
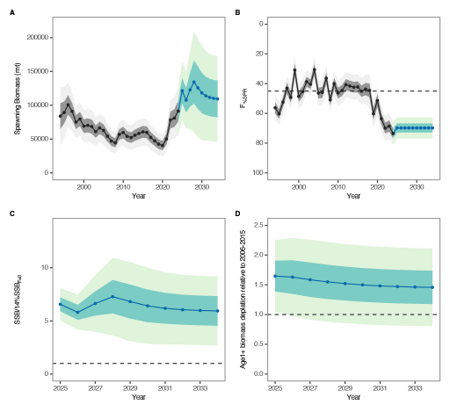
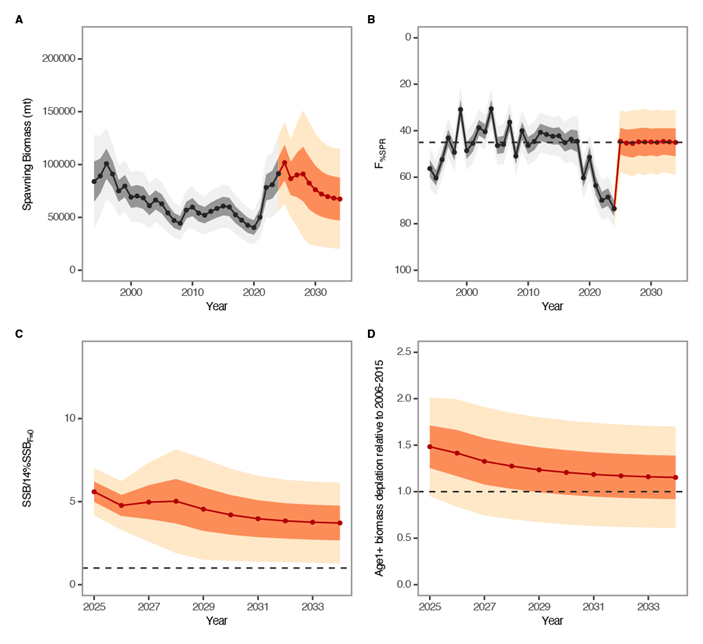
The constant fishing intensity scenario showed that the current fishing intensity (F2021-2023) is expected to result in female SSB increasing to 109,384 t (95% CI: 82,915 – 136,573 t) and a SSB/SSBcurrent,F=0 ratio of 0.83 by 2034. Over the next 10 years, there was: 1) a 100.0% probability of the female SSB remaining above the 14%SSBcurrent,F=0 LRP for all 10 years; 2) a 86.5% probability of the total biomass (age-1+) depletion being above the average of 2006 – 2015 for any year; and 3) a 95.3% probability of the fishing intensity remaining at or below the F45%SPR TRP for any year (Figure 6). For the second scenario, the period 2005–2019 was chosen because IATTC and WCPFC implemented the current management measures (WCPFC CMM 2019-03; IATTC Resolution C-05-02) that maintains albacore fishing effort at or below the average effort levels during 2002–2004 but before recent declines in F after 2020. If future fishing intensity is similar to the 2005 – 2019 period, it is expected to result in female SSB increasing to 67,340 t (95% CI: 47,082 – 87,597 t) and a SSB/SSBcurrent,F=0 ratio of 0.52 by 2034. Over the next 10 years, there was: 1) a 99.1 % probability of the female SSB remaining above the 14%SSBcurrent,F=0 LRP for all 10 years; 2) a 79.9 % probability of the total biomass (age-1+) depletion being above the average of 2006 – 2015 for any year; and 3) a 48.8% probability of the fishing intensity remaining at or below the F45%SPR TRP for any year (Figure 7).
Based on these findings, the following conservation information is provided:
- If fishing intensity over the next 10 years is maintained at the current fishing intensity (F2021-2023), then female SSB is expected to increase to around 83% of SSBcurrent,F=0 (109,384 t) by 2034, with a 100.0% probability that female SSB will remain above the 14%SSBcurrent,F=0 LRP for all 10 years and the harvest strategy management objectives of the IATTC and WCPFC (IATTC Resolution C-23-02; WCPFC Harvest Strategy 2023-01) will likely be met; and
- If fishing intensity over the next 10 years is similar to the 2005 – 2019 period, then female SSB is expected to decrease to around 52% of SSBcurrent,F=0 (67,340 t), with a 99.1 % probability that female SSB will remain above the 14%SSBcurrent,F=0 LRP for all 10 years and the harvest strategy management objectives of the IATTC and WCPFC (IATTC Resolution C-23-02; WCPFC Harvest Strategy 2023-01) will likely be met.
